Azure AI Gateway & Cost Attribution
Validation
Everything in this document was produced by deploying the examples to a real Azure subscription and driving real traffic through them. No figure here is estimated, and nothing was asserted that was not measured.
It is written up for one reason: an accelerator that has only ever been linted is a plausible-looking
guess. Of the defects listed below, none could be caught by terraform validate, terraform fmt,
tflint, checkov, or the repository’s own policy renderer. Every one of them needed an apply
against a live subscription, and several needed live traffic on top of that.
| Subscription | Visual Studio Enterprise subscription, single tenant |
| Regions | East US (primary), West Europe (secondary) |
| Gateway | API Management, VNet-injected, External |
| Models | gpt-4.1 and gpt-4.1-mini @ 2025-04-14, text-embedding-3-large @ 1 |
| Examples | 01-quickstart, 02-production-private, 03-cost-attribution |
| Semantic cache | Azure Managed Redis Balanced_B0, RediSearch |
Per-user attribution (§3b) was validated separately, by layering example 03 onto an existing API Management instance:
| Gateway | API Management, existing instance, caller_authentication = both, user attribution on |
| Models | gpt-5.5 (chat) and text-embedding-3-large (embed) |
| Caller | a regular member account in the gateway’s tenant, signed in through Azure CLI as the pre-authorized client application |
| Streaming backfill | gateway LLM logs to a Log Analytics workspace, log_analytics_workspace_id set |
1. What was tested
| Area | How | Result |
|---|---|---|
| Quickstart deploys and works | terraform apply, then scripts/smoke_test.py |
10 / 10 checks pass |
| Production example deploys and works | terraform apply, then scripts/smoke_test.py |
10 / 10 checks pass |
| Weighted load balancing | 200 requests at chat-fast, pool weighted 70 / 30 |
69.8 % / 30.2 % |
| Priority failover | 70 requests at chat, pool priority 1 / 2 |
primary-only until it throttled, then spill |
| Streaming | scripts/smoke_test.py, plus a direct comparison against Foundry |
50 chunks over 0.23 s |
| Chargeback ledger | 79 requests across 4 consumers and 3 products | every attribute populated |
| Cost-attribution example | terraform apply, then scripts/smoke_test.py |
12 / 12 checks pass |
| Semantic cache economics | 3 prompts × 3 passes, cache on | 6 hits priced at 0, 66.7 % cost avoided |
| Content safety | prompts from 5 k to 16 k characters | limit found and handled |
| Pricing map | scripts/generate_pricing_map.py |
live Azure retail prices API |
| Per-user attribution | delegated (OBO) token + subscription key: chat, streamed chat, embedding | every row names app and user |
| Streamed usage backfill | streamed chat, joined to ApiManagementGatewayLlmLog on requestId |
31 tokens backfilled, usageSource = llmlog |
| Anonymous callers | no subscription key; no bearer token | 401, recorded as unauthenticated / none |
| Per-user workbook and alerts | Allocation by individual, user spend, unattributed users, unmeasured, telemetry gap | named row, $0.0012; guard-rail alerts at 0 % |
2. Load balancing
How the backend is identified
A load-balanced pool cannot be verified without knowing which member served each request, and at the
start of this exercise nothing exposed that. x-ai-deployment and x-ai-pool are both resolved
before routing, so every member of a pool reports identical values, and the gateway deliberately
deletes Foundry’s own x-ms-region header to avoid leaking backend detail.
The gateway now promotes that region to x-ai-region on the response and backendRegion in the
ledger. A region name is not a hostname or a resource name, so nothing sensitive is disclosed, and
load balancing becomes verifiable by the caller rather than a matter of trust.
Weighted pool — 70 / 30
chat-fast is configured across both regions with weights 70 and 30 at equal priority.
python scripts/loadbalance_test.py --alias chat-fast --requests 200 --delay 0.25 \
    --expect "East US=70" --expect "West Europe=30"
  199 succeeded, 1 failed

  REGION                   COUNT     SHARE
  East US                    139     69.8%
  West Europe                 60     30.2%

  East US                expected  70.0%  actual  69.8%  PASS
  West Europe            expected  30.0%  actual  30.2%  PASS
An earlier run of the same test reported 53 / 47 and looked like a weighting bug. It was not: that
run produced ten 429s from the primary, and the circuit breaker correctly diverted traffic to the
secondary. Reading the backend configuration out of Azure confirmed the weights had been 70 and 30
all along. Under throttling, the observed split is not the configured split, and it should not
be — that is the breaker working. Raising the deployment capacity removed the throttling and the
configured ratio appeared almost exactly.
Priority pool — failover
chat is configured with the same two regions at priority 1 and 2. A priority pool looks wrong when
it is working, because provoking any failure produces a split, and a bare percentage cannot tell
“failover engaged” apart from “weights are wrong”. Ordering can:
  60 succeeded, 10 failed

  REGION                   COUNT     SHARE
  East US                     46     76.7%
  West Europe                 14     23.3%

  failover timeline
    first failure at request 33 of 70
    requests to East US before that: 32
    requests elsewhere before that: 0
    requests elsewhere after that:  14
    -> consistent with priority failover: the preferred region took everything
       until it started refusing, and only then did traffic move
Not one request reached the secondary region before the primary began refusing work, and every
secondary request came after. That is exactly the contract of a priority pool. loadbalance_test.py
now performs this correlation itself, so the conclusion is reproducible rather than hand-checked.
3. Cost attribution
79 requests were driven through four consumers across three products, mixing short prompts, large prompts, streaming and embeddings, then read back out of the ledger.
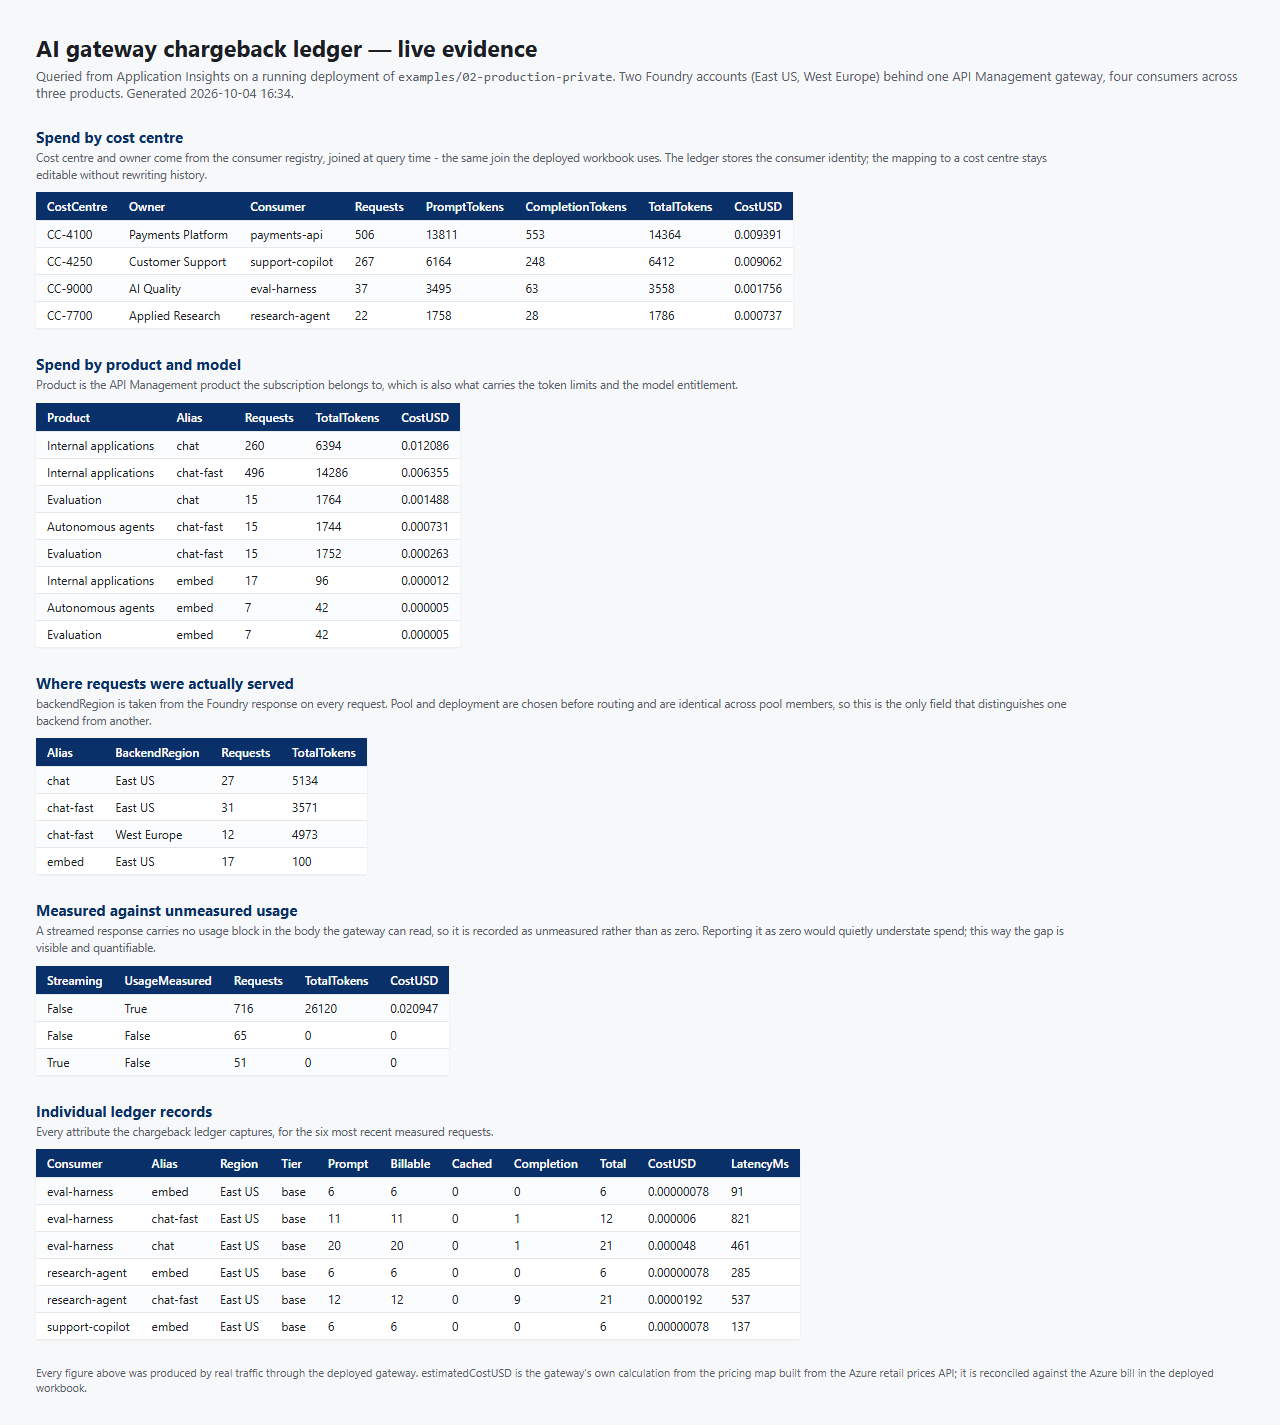
Points worth drawing out:
- Cost centre is joined at query time, not stamped on each record. The ledger stores the consumer identity; the registry maps it to a cost centre and owner. Re-organising cost centres therefore does not require rewriting history.
- Unmeasured usage is recorded as unmeasured, never as zero. In the run above, 51 streamed
requests and 65 failed requests carry no usage, because a streamed response has no usage block the
gateway can read and a rejected request never reached a model. Reporting those as zero would
quietly understate spend; reporting them as unmeasured makes the gap visible and quantifiable.
This run predates the streaming backfill; with
log_analytics_workspace_idset, streamed rows are now costed from API Management’s LLM log, as §3b shows. estimatedCostUSDis the gateway’s own calculation, from a pricing map generated against the live Azure retail prices API, and is reconciled against the real bill in the deployed workbook. Per-request costs run to eight decimal places — a ten-token embedding costs about0.00000078USD, which is why the field is formatted at that precision rather than rounded to cents.
3b. Per-user attribution
A regular member account — not an administrator, not a guest — signed in with Azure CLI, which was
pre-authorized as a client application on the gateway’s app registration, and requested a delegated
token for the gateway’s API. Its claims were the ones a real consuming application’s On-Behalf-Of
token carries: azp = the client application, oid = the user, scp = user_impersonation. Three
requests were sent with that token and a subscription key, then read back out of the ledger.
The ledger, row by row:
| Operation | Streamed | Consumer | User (oid) |
userType |
usageSource |
Prompt | Completion | Total | estimatedCostUSD |
|---|---|---|---|---|---|---|---|---|---|
chat |
no | azure-cli |
aba35792-… |
delegated | policy |
13 | 18 | 31 | 0.000605 |
chat |
yes | azure-cli |
aba35792-… |
delegated | llmlog |
13 | 18 | 31 | 0.000605 |
embed |
no | azure-cli |
aba35792-… |
delegated | policy |
3 | 0 | 3 | 0.00000039 |
| Total | 65 | 0.00121 |
The consumer is the client application’s id, 04b07795-…, shown by name through the consumer
registry. Every successful response carried x-ai-consumer: azure-cli and x-ai-user: <oid>.
The workbook’s Allocation by individual view, for the same window:
| Individual | Department | Cost centre | Application | Operations | Requests | Tokens | Share of app | Estimated USD | Allocated USD |
|---|---|---|---|---|---|---|---|---|---|
| Muazu Isah | AI Platform | CC-TEST | azure-cli |
chat, embed | 3 | 65 | 100 % | $0.0012 | $0.0012 |
The name, department and cost centre come from the users map; nothing about them is read from the
token. Remove the entry and the row is still there, keyed by object id.
Requests that must not be attributed:
| Request | Status | Ledger consumerId |
Ledger userId |
|---|---|---|---|
| Bearer token, no subscription key | 401 SubscriptionKeyNotFound |
unauthenticated |
none |
| Subscription key, no bearer token | 401 TokenNotPresent |
unauthenticated |
none |
Alerts over the same window: per-user daily spend $0.0012 against a $5 threshold, unmeasured usage 0 %, unattributed users 0 %, telemetry gap 0 %.
Points worth drawing out:
- The streamed row is not a hole any more. The policy still refuses to buffer a stream, so it
wrote the row with no usage; the ledger query then joined it to
ApiManagementGatewayLlmLogonrequestIdand filled in exactly the tokens the identical non-streamed call measured. The backfill has no cached-token or reasoning split, so a backfilled prompt is priced at the full input rate. - “Regular user” is the point. Nothing in the path depends on the account’s role. Any member or guest who can obtain a token for a pre-authorized client application is attributed, with no per-user onboarding.
- Sub-cent spend is real spend. At three requests the total is a tenth of a cent, which the
workbook first displayed as
$0.00— defect 20.
Several people through the same application
The same application (Azure CLI) was then used by four people: the account above plus three
newly created member accounts with no roles and no per-user gateway configuration. Each signed in
to its own Azure CLI profile and called the gateway with
scripts/call_as_user.py, with a deliberately different mix of
traffic:
| Person | Traffic sent |
|---|---|
| Alice | chat, streamed chat and embeddings, three times each, plus one chat |
| Bob | chat only, eight requests |
| Carol | embeddings and streamed chat, four times each |
| Muazu | a mix of all three, from the earlier runs |
Every response carried x-ai-consumer: azure-cli and the caller’s own object id in x-ai-user;
the script checks the second against the token, and every call passed. Three of those people were
then added to the users map, and the deployed workbook’s Allocation by individual query
returned:
| Individual | Department | Cost centre | Application | Models | Requests | Tokens | Share of app | Estimated USD | Allocated USD |
|---|---|---|---|---|---|---|---|---|---|
| Bob Test | Finance | CC-2002 | azure-cli |
chat | 8 | 461 | 28.1 % | $0.0105 | $0.0105 |
| Muazu Isah | AI Platform | CC-TEST | azure-cli |
chat, embed | 13 | 496 | 30.2 % | $0.0104 | $0.0104 |
| Alice Test | Claims | CC-1001 | azure-cli |
chat, embed | 10 | 404 | 24.6 % | $0.0083 | $0.0083 |
| Carol Test | Research | CC-3003 | azure-cli |
chat, embed | 8 | 281 | 17.1 % | $0.0055 | $0.0055 |
| Total | 39 | 1,642 | 100 % | $0.0348 | $0.0348 |
The coverage tile over the same window: 4 individuals, 100 % of tokens attributed to a person, 0 % app-only, 0 % unattributed.
- One application, four bills. Application-level attribution alone would have reported a single
azure-cliline of $0.0348; the individual view splits it by person, department and cost centre. - Cost follows what was used, not just how much. Bob used fewer tokens than Muazu but cost more, because all of his were chat completions; Carol’s traffic was mostly embeddings, the cheapest per token. Per-request pricing in the gateway carries that through to the person.
- Carol’s streamed calls are costed. Half her requests were streamed; they were backfilled from the LLM log rather than reported as unmeasured.
- New users need no onboarding. The three accounts were attributed from their first request.
The
usersmap only adds names, departments and cost centres; it is not an allow-list. - Test accounts and MFA. In a tenant whose Conditional Access requires MFA for every sign-in, a new account cannot sign in with a password alone. A Temporary Access Pass satisfies the policy without registering a method; the accounts were deleted afterwards.
4. Defects found and fixed
Every one of these was found by deploying. They are listed because the failure modes are instructive, not merely because they were fixed.
Resource counts gated on unknown values — three modules
count and for_each were gated on whether another resource’s attribute was null, for resources
created in the same apply. Terraform cannot resolve that at plan time:
Invalid count argument: the "count" value depends on resource attributes
that cannot be determined until apply.
Both examples were unappliable, including the private-endpoint block that is example 02’s headline
feature. terraform validate does not resolve count or for_each, so nothing in CI could see it.
Fixed with plan-time-known booleans (enable_diagnostics, enable_private_endpoints) plus
preconditions that name the offending value at apply time.
Response body reads disabled streaming
An expression reading context.Response.Body makes API Management buffer the entire response before
outbound policy runs — even when the expression provably never executes. The read was guarded on
Content-Type: application/json, and streamed responses are text/event-stream, so it never ran, and
the gateway buffered anyway.
Measured: Foundry streamed 50 chunks over 0.80 s; the gateway released all 50 within 1 ms. The fix skips the element entirely for streamed requests rather than guarding inside it, restoring a 0.23 s spread while non-streaming token accounting continues to work.
Content safety was called without credentials
Every generative request failed with 403 Request failed content safety check, while embeddings —
which skip content safety — kept working. The gateway therefore looked like it was moderating
correctly rather than like it was broken. Telemetry showed the truth:
401 Access denied due to invalid subscription key or wrong API endpoint.
llm-content-safety forwards the request’s current Authorization header, and the managed-identity
token was being attached after content safety ran. Acquiring it earlier fixes it, with no API key
anywhere. Ordering, not configuration.
Content safety silently caps prompt length at 10,000 characters
Azure AI Content Safety assesses at most 10,000 characters per call. A longer prompt does not come back as unsafe — the screening call fails, and that failure is reported identically to a genuine moderation block. Measured on this deployment:
| Prompt | Before | After |
|---|---|---|
| 9,266 characters | 200 |
200 |
| 11,294 characters | 403 Request failed content safety check |
413 ContentSafetyInputTooLong |
The request still has to be refused, but it is now refused honestly, naming the real constraint and the actual length. The previous behaviour sent people hunting for offending words in documents that contained none, and it fell hardest on exactly the long-context traffic these models exist to serve.
A consequence worth planning around: with content safety enabled, prompts cannot grow large enough
to reach a long-context rate card, so contextTier stays on base.
API Management deployed before its subnet had an NSG
API Management refuses to deploy into a subnet with no network security group. The module created one and associated it, but nothing downstream referenced the association, so Terraform was free to build the gateway while it was still in flight — failing intermittently, and appearing to fix itself on a re-run. The subnet outputs now depend on their NSG and NAT gateway associations, so every consumer is ordered correctly without having to know the rule exists.
Private endpoints were created in the wrong region
A private endpoint lives in the region of its subnet, not of the resource it fronts. With a second
Foundry account in West Europe and a single East US network, the apply failed with
InvalidResourceReference. Endpoints now default to the network’s region; targeting a resource
across regions is supported and is the normal topology for multi-region Foundry behind one network.
A metric alert that could never be created
token_burn_rate watches Total Tokens, a custom metric the gateway policy emits. Azure validates
metric names on creation and rejects names it has never seen, so the alert could not be created on a
fresh deployment — it needed the traffic it existed to watch. Resolved with skip_metric_validation.
A log alert with an impossible evaluation window
telemetry_gap asked for 3 evaluation periods over a query that collapses its window to a single
number. Azure requires exactly 1 unless the query projects a datetime column named timestamp.
The other four rules in the module were already 1/1.
A banned .NET type in a policy expression
System.Globalization.CultureInfo is not permitted in API Management expressions, and its use
rejects the entire policy document. It appeared only in the cost-attribution path, so every
quickstart deployment passed while the production example could not deploy at all.
scripts/check_policies.ps1 now fails on the known-forbidden namespaces, turning a three-quarter-hour
apply failure into an immediate local one. Well-formed XML was never sufficient.
A trace property that collided with a built-in
The serving region was first recorded as region, which collides with the Region property API
Management attaches for the gateway’s region. Two properties differing only in case meant the
query for “where did traffic go” and the query for “where does the gateway run” looked nearly
identical and answered different questions — and some clients, including PowerShell’s JSON parser,
refuse to load such a record at all. Renamed to backendRegion.
Models that cannot be deployed but still look available
gpt-4o-mini 2024-07-18 is rejected for new deployments with ServiceModelDeprecating, while
az cognitiveservices model list still advertises inference until 2027. The catalogue date describes
serving, not deploying. Examples are pinned to gpt-4.1 / gpt-4.1-mini @ 2025-04-14, and the
examples carry the command to re-check before deploying.
A JSON null is not a null
A usage block can carry "total_tokens": null. In an API Management expression that arrives as a
JValue whose Type is Null — not as a C# null. So token ?? fallback does not fall
through, token == null is false, and the (int) cast that follows throws.
The consequence is worse than the cause. An expression that throws inside set-variable leaves the
variable unset rather than failing the request, so nothing is reported at the point of failure.
The damage surfaced much later, at the first downstream reader — a set-header — as:
ExpressionValueEvaluationFailure at set-header[6]
The given key 'totalTokens' was not present in the Variables dictionary.
Every affected request returned 500 to the caller. Token extraction now treats a JSON null as
zero explicitly, and the governance headers read through GetValueOrDefault, so no single unset
variable can turn a served response into an error.
The outbound section does not start where you think on a cache hit
The headline defect, and the only one that produced a wrong number rather than an error.
On a semantic cache hit, API Management injects the cached response and resumes outbound execution
at the llm-semantic-cache-store element — not at the top of the section. With the store in its
intuitive position (last, because storing is logically the final step), a cache hit skipped all of
usage extraction, all of the cost calculation, and the chargeback trace.
Measured on the live gateway, a replay:
- returned the original request’s
x-ai-estimated-cost-usd, because that header had been captured inside the stored response; - reported
x-ai-total-tokens: 0andx-ai-cache-hit: false; - wrote no ledger entry at all.
All behind a 200. The single request class the cost-attribution feature exists to measure was the
one class it silently dropped, and no local check could see it: the policy is valid XML, every
expression is legal, and terraform apply succeeds.
Moving llm-semantic-cache-store to be the first element of <outbound> fixes both halves. The
stored copy is the backend’s response before the gateway annotates it, so no x-ai-* header is ever
baked into the cache; and a hit re-enters outbound at the first element, running extraction, pricing,
trace and headers against the replayed body.
After the fix, the same replay reports cacheHit: true, recovers all 39 tokens from the cached body,
prices at 0.00000000, and records costAvoidedUSD equal to the original call’s cost — in 273 ms
against 2887 ms.
14. The semantic cache answers questions it was never asked
Found by running the smoke suite a second time. The first run passed 12/12; the re-run failed. Nothing had changed except that the cache was now warm, which is the normal state of a cache and the state no first deployment is ever in.
The suite made its priming prompt unique with a GUID. That is not uniqueness. An embedding model barely registers a random identifier, so the prompt landed inside the match radius of the previous run’s prompt and was served from the cache. Fixing the probe exposed the real defect underneath.
A controlled pair on a never-before-seen template:
"For internal ledger 42074, ... shipping status of order number 10007 ..."  -> hit=false, cost 0.00004360
"For internal ledger 42074, ... shipping status of order number 88213 ..."  -> hit=true,  cost 0.00000000
   body returned: "The shipping status of order number 10007 ..."
A question about order 88213 was answered with text about order 10007, confidently, behind a
200. cacheHit itself was verified accurate — novel prompts still price and meter correctly — so
this is the cache matching, not the measurement failing.
Measuring the embedding distances explains why, and shows that no threshold fixes it:
| Prompt pair | Cosine distance |
|---|---|
| order 10007 vs 88213, bare | 0.121 |
| the same pair as actually sent | 0.036 |
| the same pair behind a three-paragraph preamble | 0.018 |
| “How do I reset my password?” vs “What is the process for resetting my password?” | 0.150 |
| “How do I reset my password?” vs “How do I cancel my subscription?” | 0.532 |
A genuine paraphrase (0.150) is farther apart than two different orders (0.121) or two different customers (0.109). The two populations overlap, so no threshold admits paraphrases while rejecting different records. Worse, shared context dilutes the distinguishing token: the same pair falls from 0.121 to 0.018 as boilerplate grows, so production traffic — heavy with system prompts and retrieved context — is more exposed than a test, which is why this survives casual trial.
Three changes, none of which is a threshold:
<vary-by>now includes caller identity by default (share_across_consumers = false), so a near-match can never serve one consumer a response generated for another. This was the serious half: without it the collision crosses tenants and becomes a disclosure rather than a wrong answer.- The guidance was corrected. Both
variables.tffiles claimed 0.05 was conservative and that “above roughly 0.2” was where trouble started. The default itself was already returning wrong answers. - The suite now derives its priming prompt from randomly chosen subject matter, so repeat runs are genuinely independent. Verified by running it twice back to back against a warm cache: 12/12 both times.
The residual risk is documented rather than fixed, because it cannot be fixed by configuration: do not enable semantic caching on routes whose answers depend on an identifier in the prompt.
15. A redaction mask committed into an alert query
Found by provisioning from a clean clone, following the README literally — the path a first-time user takes and the only one that exercises every resource from nothing.
terraform apply failed against the live service:
creating Scheduled Query Rule "...-ai-cache-economics": 400 BadRequest:
Query could not be parsed at '*' on line [54,16]
Line 54 of the rendered query was | where statusCode between (200 .. 299). The source did not say
statusCode. It said status followed by six asterisks — a terminal’s secret-redaction mask, copied
back into the file when the cache-economics alert was written, and committed in b372945.
Nothing in the existing checks could catch it. The file is valid HCL, terraform validate passes,
terraform plan succeeds, and the policy renderer never looks at Terraform’s monitoring resources.
The break exists only in a string that Azure parses, so it surfaces at apply time against the live
service and nowhere earlier. It had gone unnoticed because the alert is opt-in and had never been
deployed until this run.
Two fixes:
- The identifier was restored by hand rather than re-copied from a terminal, which is how it was corrupted in the first place.
scripts/check_policies.ps1now fails on any run of three or more asterisks in.tf,.tftpl,.xml,.py,.ps1or.jsonfiles. A mask is never legitimate in those file types, and the check costs nothing. Verified by injecting one and confirming a non-zero exit.
The general lesson is worth more than the specific bug: a KQL query embedded in Terraform is a string to every tool in the chain, so it is validated by nobody until Azure sees it. Anything that reaches a service as text needs a deployment to prove it.
16. The documented cost-attribution path collided with itself
The same clean-room run found three gaps in the README’s example 03 procedure, all of which stop a first-time user:
- Example 03 defaults to
api_path = "openai/v1", which is exactly the path the quickstart has already published on the same API Management instance. Two APIs cannot share a path, so following the README as written fails at apply time. - The listed outputs omitted
application_insights_instrumentation_key, which example 03 requires. - The template’s
model_routesnamegpt-4.1andtext-embedding-3-large; the quickstart deploysgpt-4.1-miniandtext-embedding-3-small. The plan-time pool check catches the mismatch, but the README gave no warning it would.
All three are fixed in the README, which now states the required edits and shows the pricing-map generator producing aliases that match the routes.
17. Two gateways on one API Management instance collided
With the path and the routes corrected, the apply still failed:
a resource with the ID ".../backends/foundry-primary" already exists -
to be managed via Terraform this resource needs to be imported into the State
The module named its Foundry backends foundry-<key>, its pools pool-<alias>, and its content
safety backend content-safety — none of them prefixed. Backends live in the API Management
instance’s namespace, not in a resource group, so the name is only unique per instance. Example 01
had already created foundry-primary from the same map key, and example 03 tried to create it again.
This broke the module’s headline use case. “Layer onto API Management you already own” only worked as long as that instance was not already running this module — which is exactly what the README tells you to do.
Named values and loggers were already prefixed with name_prefix; the backends had simply been
missed, and nothing caught it because every deployment until now put one gateway on one instance.
All four names are now prefixed, and the route table the policy reads was updated to match.
This is a breaking change for existing deployments: renaming a backend replaces it. Expect Terraform to destroy and recreate the backends and pools on the next apply, which briefly interrupts traffic. Nothing else is affected — the API, its policy and the subscription keys are untouched.
18. A duplicate display name hung the apply for thirty minutes
With the backends namespaced, the apply got further and then stopped dead:
azurerm_api_management_api.llm: Still creating... [12m30s elapsed]
...
Error: creating Api: HTTP response was nil; connection may have been reset
The API never appeared in the portal. Everything about the message pointed at the network, and nothing about it was true.
Running the apply targeted, with TF_LOG=DEBUG, showed the provider issuing the same PUT over and
over with exponential backoff — 2s, 4s, 8s, up to 63s — and never logging a response. Pulling the
exact 406-byte request body out of the debug log and replaying it by hand with az rest produced
what the provider was hiding: 502 Bad Gateway, with an HTML body. The provider classifies 502 as
transient, so it retried until the thirty-minute create timeout expired.
Bisecting the body isolated the field:
| Probe | displayName |
Result |
|---|---|---|
pa |
unique, full provider body | 201 |
pb |
unique, minimal body | 201 |
pc |
AI Gateway (dev) — already used |
502 |
API Management rejects a duplicate API display name on an instance with 502 rather than 409. The
module hardcoded display_name = "AI Gateway (${var.environment_name})", so any two deployments in
the same environment collided — the same single-instance assumption as defect 17, surfacing as a
hang instead of an error.
The default is now AI Gateway (<name_prefix>), which fix 17 already guarantees to be unique per
instance, and api_display_name overrides it.
Probing further showed products behave identically: a second product reusing an existing display
name also returns 502. Examples 01 and 03 ship different product names, so it had never been hit.
Product display names now default to the key qualified by name_prefix. That is an in-place update,
not a replacement, so existing deployments see a rename and nothing more.
19. The telemetry-gap alert measured the wrong denominator
On the first per-user run the telemetry-gap alert reported 92.68 % of requests missing from the ledger, on a gateway that had in fact recorded every one.
The alert compared the count of ledger traces with the count of every request Application
Insights held. On a shared API Management instance that includes other APIs, probes against paths
that match no operation (404), and requests rejected before the gateway policy ran — none of which
ever produce a ledger row. The more the instance was used for anything else, the worse the gap
looked.
The alert now looks only at requests on the gateway API (the new optional gateway_api_name input,
wired in examples 02 and 03), and only at 2xx and 5xx responses, and matches each one to its own
llm.request or llm.error trace by operation_Id instead of comparing totals. On the same traffic
it reports 0 %.
20. Small spend was displayed as zero
The Allocation by individual view showed one user at $0.00 estimated, $0.00 allocated after
three successful requests. The ledger held 0.00121. The workbook queries rounded USD sums to two
decimals and the grid’s currency formatter showed two digits, so any user or application below half
a cent read as free — exactly the people a per-user view exists to show.
The queries now keep six decimals (four for cost per thousand tokens) and every USD column displays up to four. The same row now reads $0.0012 / $0.0012.
5. Reproducing this
cd examples/02-production-private
terraform init && terraform apply

python scripts/smoke_test.py      --base-url <url> --api-key <key> --model chat-fast
python scripts/loadbalance_test.py --base-url <url> --api-key <key> --alias chat-fast \
    --requests 200 --delay 0.25 --expect "East US=70" --expect "West Europe=30"
python scripts/generate_demo_traffic.py --base-url <url> \
    --consumer "payments-api=<key>:chat,chat-fast,embed" \
    --consumer "research-agent=<key>:chat-fast,embed"
Give Application Insights a few minutes to ingest, then open the chargeback workbook.
To reproduce the per-user results, set the caller and user_attribution variables in example 03
(see the OBO integration guide), add Azure CLI’s application id
04b07795-8ddb-461a-bbee-02f9e1bf7b46 to the gateway app registration’s pre-authorized clients and
to caller_client_application_ids, then sign in as an ordinary user:
az login --tenant <tenant-id>
TOKEN=$(az account get-access-token --resource <gateway-app-client-id> --query accessToken -o tsv)

curl -s "$GATEWAY/chat/completions" \
  -H "api-key: <subscription-key>" -H "Authorization: Bearer $TOKEN" \
  -H "Content-Type: application/json" \
  -d '{"model":"chat","messages":[{"role":"user","content":"Hello"}]}' -D - | grep -i '^x-ai-'
Use the gateway app’s client id (the bare GUID) as the resource: a v2 token’s audience is that GUID,
not the api:// URI, so both forms belong in caller_audiences. Repeat with "stream": true and
against the embedding alias, then check the ledger’s usageSource and the Allocation by
individual view once the LLM logs have been ingested (allow up to fifteen minutes).
scripts/call_as_user.py does all of that in one command and checks
each response’s x-ai-user against the token. To act as several people, give each one a separate
Azure CLI profile and sign in with a device code in a private browser window:
export AI_GATEWAY_ENDPOINT=https://<apim>.azure-api.net/<path>/openai/v1
export AI_GATEWAY_KEY=<subscription-key>
export AI_GATEWAY_APP_ID=<gateway-app-client-id>

python scripts/call_as_user.py                                   # as the user az is signed in as
python scripts/call_as_user.py --az-config-dir ~/.uca/alice --login --device-code --tenant <tenant-id>
python scripts/call_as_user.py --az-config-dir ~/.uca/alice --calls chat --repeat 5 --brief
Two caveats for anyone repeating the load-balancing test. Weighted distribution is only meaningful when the primary is not throttling, so give the deployments enough capacity for the request rate first. And the gateway’s own token limits are per product, so a test that borrows a production consumer’s key spends that consumer’s quota.